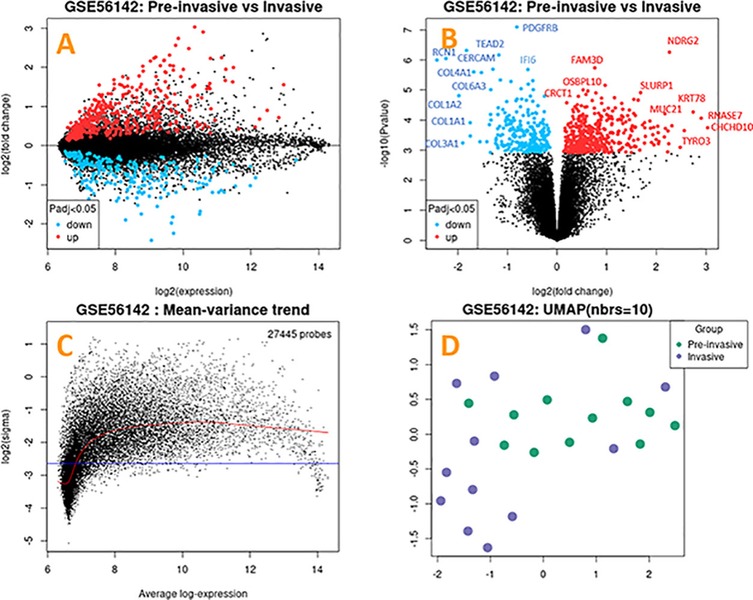
Figure 1.
Depictions of Genes with Altered Expression.
A: Volcano plot showing the prevalence of genes between the normal and invasive OSCC groups. Black dots, normal gene expression; blue dots, down-regulation; red dots, up-regulation at log2. B: Volcano plot showing high variance distribution between expression genes at log10. (Colors same as in panel A.) C: Average log expression of 27,445 probes: above red line are up-regulation genes; below the blue line are down-regulation genes. Black dots mark distribution of genes. D: A UMAP plot presenting sample distribution by color. Green dots, normal group; purple dots, invasive OSCC group.